| Rainfall patterns at the Fly Gap Division of the Double Helix Ranch, Mason County, Texas | |
|
Professor, University of Texas at Austin This article discusses the long-term rainfall patterns at the Fly Gap Division of the Double Helix Ranch, and the relationship between El Niño cycles and the droughts and wet periods common to this area of central Texas. This article addresses questions such as: What caused the recent droughts of 2005-2006 and 2007-2009, and the current drought that began in Fall 2010? How severe were these droughts compared to other droughts of record? What caused the rain to return in late 2009 and early 2010? What are our prospects for an end to the current drought? What are the long-term trends for rainfall in central Texas? How will global warming affect our rainfall patterns? |
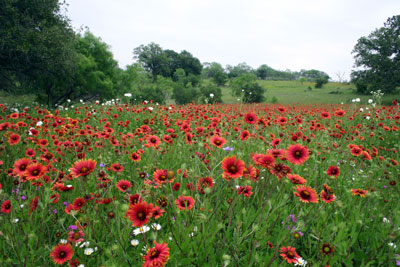
|
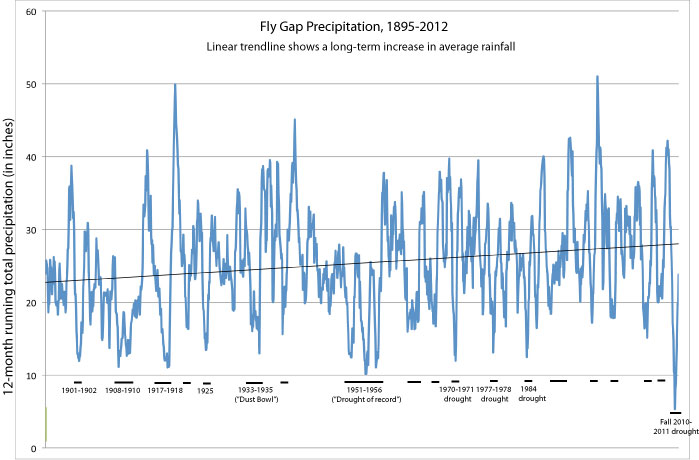
The Fly Gap Division of the Double Helix Ranch is located in central Texas, close to the geographical center of the state. The long-term average rainfall is about 26 inches per year (66 cm). However, an "average" year is quite rare. Instead, the ranch cycles regularly between wet periods (up to about double the average rainfall within a 12-month period) and dry periods (often as little as half the average rainfall). These wet-dry cycles are fairly regular, with "extreme" wet and dry periods occurring every three to five years (see the graph below):
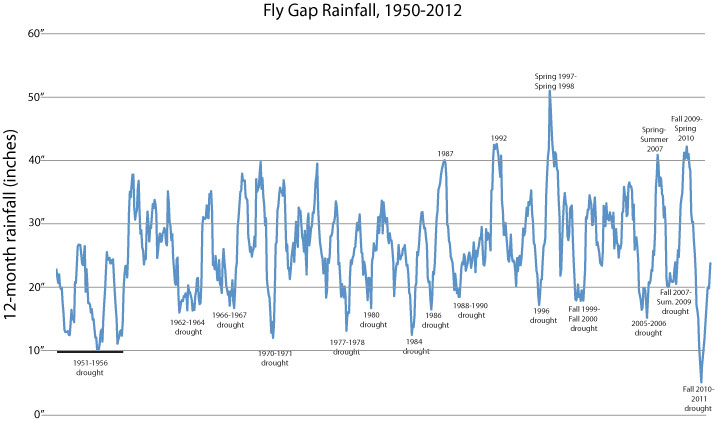
In this graph, each plotted point (one per month) shows the total rainfall for the previous 12 months. Since this 12-month moving sum always includes a full year, the cycles have no relationship to any seasonality (in other words, each 12-month period includes each of the months of January through December). I have marked some of the major droughts and wet periods over the past 60 years. In particular, notice the severe drought of record in the early 1950s. Also, notice that the wettest wet periods have been in the past two decades, and that the current (2010-2011) drought is the worst since the drought of record in the early 1950s (for a single year, October 2010 through September 2011 was the driest 12 months on record). The 1950s drought actually consisted of three droughts of similar intensity to the current drought in a row, with short periods of near-average precipitation in between each major dry period. Although our recent droughts have been compared in the news media to the drought of the early 1950s, the 1950s drought was much longer, more widespread, and severe than any drought that we have experienced since (although we are getting close in 2010-2012). For example, many major rivers in south and central Texas (such as the Llano River and the Medina River) stopped flowing or dried completely during the 1950s drought. These rivers have not stopped flowing again since then, despite much higher water use from growing human populations, although we are now very close with the current drought. We were fortunate that most of our recent severe droughts were followed by very wet conditions (associated with El Niño episodes). For example, the 2005-2006 drought was followed by an El Niño episode in late 2006 through summer 2007, before the drought conditions returned in late 2007. Another very wet period (associated with another El Niño episode) in winter of 2009-2010 followed the drought of 2007-2009. These wet-dry cycles in central Texas are caused largely by the fluctuations in ocean temperatures in the equatorial Pacific Ocean (the El Niño Southern Oscillation). When the equatorial Pacific Ocean temperatures rise, rainfall in central Texas increases (especially from fall to spring). When these ocean temperatures fall, rainfall in central Texas decreases. Long periods of above-average Pacific Ocean temperatures are called El Niño episodes, and long periods of below average temperatures are called La Niña episodes. Specifically, the Ocean Niño Index (ONI) measures the departures in temperature from the long-term average in an area of the Pacific Ocean known as Niño 3.4. El Niño episodes are declared when the ONI is above 0.5 degrees (C) for five or more consecutive overlapping three-month periods, and La Niña episodes are declared when the ONI is below 0.5 degrees for five or more consecutive overlapping three-month periods. (If the ONI is above or below the 0.5 C range but it has not yet been there long enough to declare an El Niño or La Niña episode, then El Niño or La Niña conditions are said to exist.) There are exceptions to the pattern of wet El Niño years and dry La Niña years, of course. Hurricanes also can have a major influence on our rainfall patterns in the summer and fall, and hurricanes tend to be suppressed in El Niño years and more active in La Niña years. However, research published in 2009 (Impact of shifting patterns of Pacific Ocean warming on north Atlantic tropical cyclones; Science 325: 77-80) suggests that there are actually two versions of El Niño episodes, depending on the exact location of the warmer water in the equatorial Pacific. In the classic version of an El Niño, the warming is in the eastern Pacific, and Atlantic hurricanes are less frequent. But in the variant El Niño, the warming is in the central Pacific, and Atlantic hurricanes are as frequent as they are in La Niña years. La Niña years tend to be dry in the winter and spring, but may get late summer/fall floods associated with hurricanes. El Niño years are often wet in the winter and spring. The wettest years of all come when we have an El Niño winter and spring, and then the El Niño breaks to allow an active hurricane season in the summer and fall. This latter pattern can also occur under the variant El Niño conditions, in which the warming occurs in the central Pacific. The following graph from the NOAA/National Weather Service Climate Prediction Center shows the El Niño/La Niña cycles since 1950:
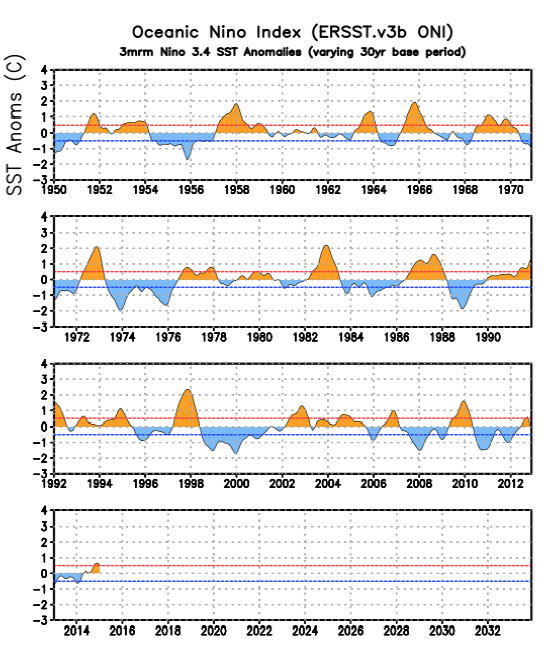
In the graph above, orange indicates El Niño conditions, and blue indicates La Niña conditions. If you compare the wet/dry cycles at Fly Gap to the El Niño/La Niña cycles, you will see that there is a close correlation. The long-lasting 2007-2009 drought resulted from a "double-dip" La Niña. Conditions briefly returned to near neutral in summer 2008, but then went right back into La Niña conditions in late 2008 and early 2009 (bringing back the drought conditions). In summer 2009, we returned to El Niño conditions, and a full El Niño episode developed in late 2009 (which produced our wet and cool winter of 2009-2010). Unfortunately, we appear to be in another double-dip La Niña in 2011-2012 (see more below). Examples of the variant El Niño episodes, in which most of the warming was in the central Pacific (El Niño area 4) rather than in the eastern Pacific (El Niño area 3), include the El Niño episodes of 1969-1970, 1991-1992, 1994-1995, 2002-2003, and 2004-2005. These variant El Niño episodes appear to be becoming more common than the "typical" El Niño episodes. These episodes all increased our rainfall in central Texas in the expected pattern, sometimes breaking a drought in dramatic fashion with heavy tropical rainfall in the fall (e.g., the October to December rainfall for these five episodes was 13.23", 12.17", 10.75", 8.28", and 9.08", respectively, all of which are well above our average rainfall for these months of 6.86".) If we plot the ONI against the rainfall deviation from the long-term average, on a month-by-month basis for the past 20 years, the correlation of the El Niño/La Niña conditions with rainfall in central Texas is quite clear:
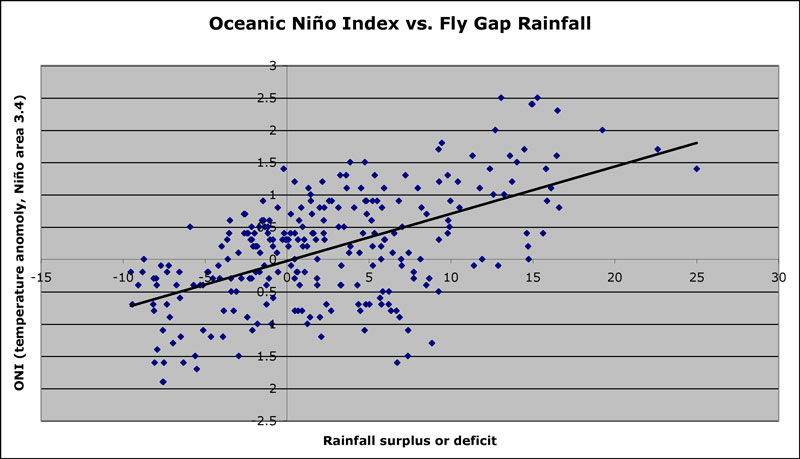
In particular, note that when the ONI is above 1.0, Fly Gap (located very close to the geographic center of Texas) is almost always wetter than the long-term average (there is a rainfall surplus). When the ONI is below -1.0, Fly Gap is likely to be in drought (a rainfall deficit, although this pattern is somewhat more variable). Some of the variation stems from the fact that El Niño episodes (when the ONI is high) tend to produce wet weather in central Texas from fall through spring, but drier than normal weather in the summers. The NOAA/National Weather Service Climate Prediction Center presents the following map to describe the usual winter weather pattern that accompanies an El Niño episode. Notice that the Pacific Jet Stream brings wet, cooler weather over Texas:
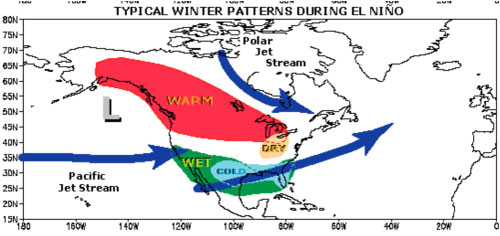
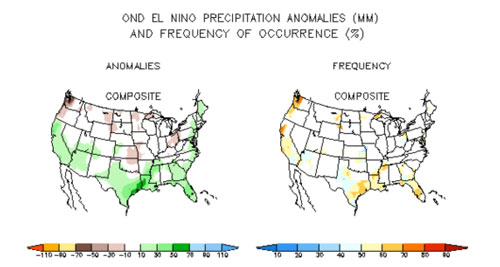
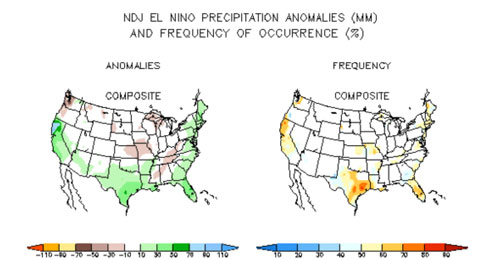
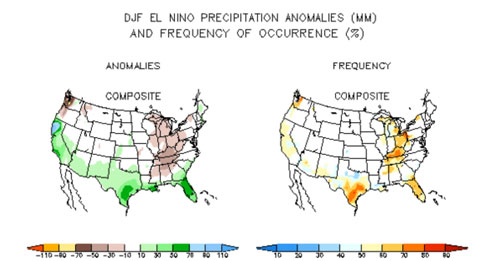
The usual wet winter pattern for an El Niño episode (as expected in central and south Texas) is somewhat less predictable in north or west Texas, and of course every El Niño episode does not necessarily bring wetter winter weather—it simply improves our chances for wet weather. The following maps (from the NOAA/National Weather Service Climate Prediction Center) show the average precipitation deviations for the past 18 El Niño episodes (on the left; green indicates higher than average precipitation), as well as the frequency of these expected deviations over the 18 El Niño episodes (on the right; blues indicate low frequency of occurence, and oranges to reds indicate high frequency of occurence). The first map is for the months of October to December, the middle map for the months of November to January, and the third map for the months of December to February. Although almost all of Texas tends to be wetter than normal in an El Niño episode, notice that the wet winter pattern is strongest and most predictable in south-central, south, and south-east Texas:
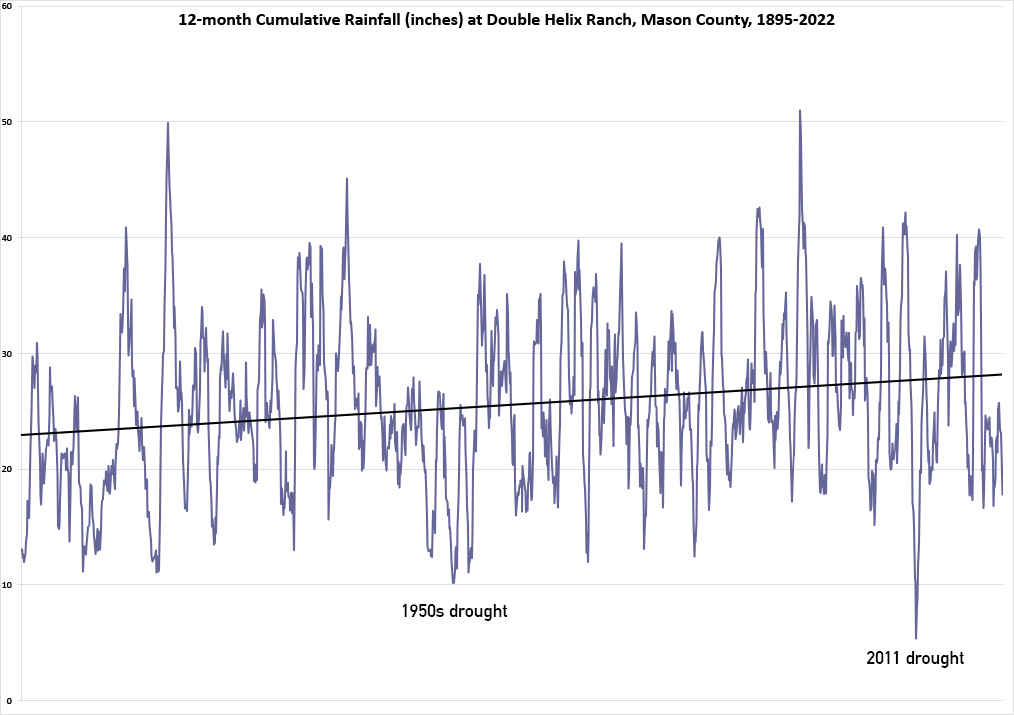
Are these patterns changing with global warming? From the graph of the El Niño/La Niña cycles and the graph of Fly Gap rainfall since 1950, notice that for the last 20 years, both the ONI and Fly Gap rainfall have tended to be above their long-term averages, consistent with the world-wide patterns of global warming. In fact, global warming may be responsible for a slow but consistent increase in our local average annual rainfall, as shown in the following graph:
Although the average across all these years is about 26 inches, note that the annual average has shifted upward by almost 8 inches over the past six decades (from about 22 to 30 inches per year), although this pattern may in part be influenced by starting analysis at the beginning of the severe drought of the early 1950s. I haven't yet re-drawn this graph to include the latest drought, but the upward trendline is still apparent when it is included. Will these long-term patterns continue in central Texas with increased global warming? There is considerable debate about that point, with different models showing different outcomes. A moderate degree of ocean warming is likely to increase El Niño events, which tend to make central Texas wetter. However, a major increase in temperatures could cause a shift in the Pacific jet stream, which supplies us with much of our moisture. An increase in temperature would increase evapotranspiration (if average wind speed remains constant), so it would take more rainfall to produce the same amount of soil moisture. However, worldwide increased evaporation also must lead to increased precipitation, since evaporation and precipitation have to be in equilibrium in the long term (otherwise, atmospheric moisture would continue to increase or decrease indefinitely). Some climate models predict increased variation in rainfall for the southwestern United States, which could increase the intensity of both droughts and floods. One recent analysis of the worldwide rainfall patterns over the past twenty years shows a slow but significant increase in global precipitation associated with global warming (How much more rain will global warming bring?; Science 317: 232-235; 2007). Although this is consistent with the effects seen locally in central Texas over the past few decades, the rainfall patterns in any one region could change quickly depending on a large number of climatic complexities. The bottom line is that the long-term predictions are all over the map for central Texas. The one thing that is clear is that global warming will produce major effects on precipitation patterns. Whether that means that central Texas will become wetter, drier, or more variable is not yet entirely clear, however. To date, recent global warming seems to have made central Texas wetter, but a switch point in the climate could end that trend suddenly. 
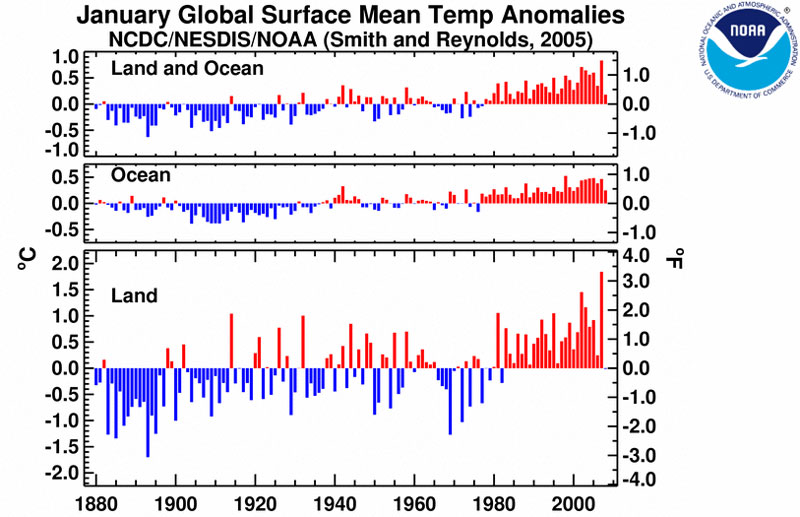
The following graph from NOAA documents the reality of global warming, and how quickly and suddenly it is happening. Note that global temperatures have been consistently above average, and steadily rising, since about 1980. One can see the beginnings of this trend dating back to about 1940:
Getting back to the effects from El Niño/La Niña cycles: The effects of this cycle are particularly evident from fall through spring. If we compare El Niño years to La Niña years in central Texas, and look at the rainfall from October to March at Fly Gap, most El Niño years are wetter than average and most La Niña years are drier than average. In the following graph (based on data from Fly Gap from 1951-2009), El Niño years are shown in blue, and La Niña years in red:
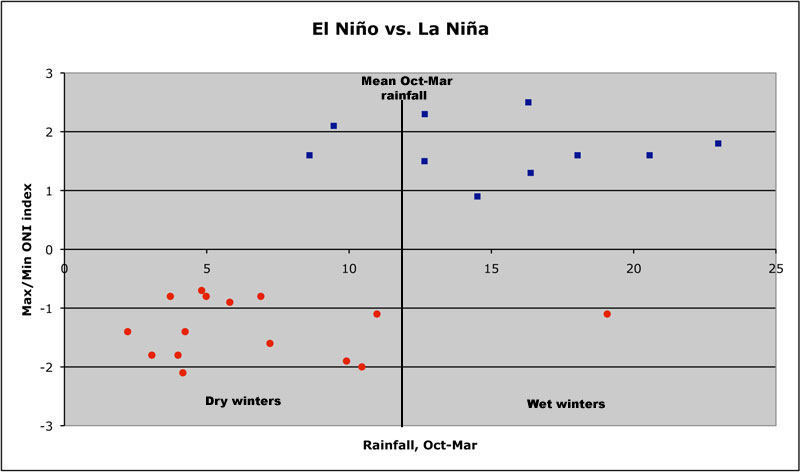
Note that almost all very wet years were El Niño years, and all the very dry years were La Niña years. Only two of ten El Niño winters were below average (the exceptions were 1965-1966 and 1972-1973), and only one of fifteen La Niña winters was above average (the exception was 1984-1985). The mean rainfall for El Niño winters is about three times the mean rainfall of La Niña winters. The recent La Niña winters of 2005-2006, 2007-2008, and 2008-2009 all fit this pattern perfectly, with just 4.82", 4.24", and 6.9"of rain from October to March in these three winters. The El Niño winter of 2009-2010 also has followed this historical pattern, with very wet and cool conditions. [Note added in 2010: the October to March total for 2009-2010 was 18.46"]. When I first wrote this article, in summer 2006, the ONI was climbing out of the negative territory it had been in since fall 2005 (when our 2005-2006 drought began). The ONI was predicted to increase, and to keep climbing for the remainder of 2006, suggesting moderate El Niño conditions developing in late 2006 and early 2007, and therefore forecasting an end to the severe 2005-2006 drought. This happened exactly as predicted. We had a wet early half of 2007, which pulled us out of the 2005-2006 drought, as seen in these maps from the National Drought Mitigation Center:
In August 2006, over 90% of Texas was in one of the drought categories, with 73% of the state in severe, extreme, or exceptional drought. After the rains in the first half of 2007, the entire state was free of drought, with many areas experiencing record rainfall. This map from the National Weather Service shows the rainfall (as a percent of normal) for 1 January to 21 August 2007: All this rain stimulated substantial vegetative growth, as seen in this NASA map of vegetative growth in June of 2007: Most of Texas showed far more vegetative growth than usual in the spring and summer of 2007, and the areas in eastern Texas that are not green on this map were under heavy cloud cover when the satellite data for this image were collected. During the latter half of 2007, we returned to La Niña conditions, and they continued throughout 2008 and the first five months of 2009, as seen in this summary of sea surface temperatures from the Pacific presented by the NOAA/National Weather Service Climate Prediction Center (in particular, notice the negative deviations in the critical El Niño 3.4 region throughout most of 2008 and early 2009):
These 2007-2009 La Niña conditions resulted in a return to our dry weather pattern for the latter part of 2007 through the first half of 2009. There was a brief period of some relief in summer 2008 in parts of central Texas, when our rainfall was a little closer to normal, but then a return to La Niña conditions, as well as a return to severe drought by late 2008 and the first half of 2009 (as monitored by the National Drought Mitigation Center):
January 2009 In the first half of 2009, the worst of the drought shifted and expanded into south Texas, with some relief in north-central Texas, but intensification in south Texas. A sharp line running through the Edwards Plateau separated nearly normal conditions in much of the northern and western portion of the Plateau and in north and west Texas from the severe to exceptional drought that gripped the southern and eastern parts of the Plateau and all of south Texas:
August 2009 The good news, however, was the forecast for an El Niño episode in fall and winter 2009-2010. We had already returned to El Niño conditions as of summer 2009, and virtually all the models monitored by the NOAA/National Weather Service Climate Prediction Center predicted a developing El Niño for fall and winter 2009-2010:
The black line shows the observed departures of sea-surface temperatures in the El Niño 3.4 region. The heavy blue line is the average of the various forecast models (shown by thin lines), as of August 2009. Thus, the models forecast a switch from a La Niña pattern to an El Niño pattern, and thus wetter conditions for late 2009 and early 2010 in central Texas. An El Niño episode gives us about a 70–80% chance of above average rainfall for October through March. There was a slight weakening of the El Niño development in August 2009, but almost all the models predicted a strengthening of El Niño conditions through the rest of 2009, which is exactly what happened. The following maps show the longterm preciptation predictions during three-month periods for September 2009 until October 2010 (predictions from August 2009). Notice that central and south Texas were predicted to have above average rainfall (shown in green) for each of the periods from October-November-December 2009 to March-April-May 2010 (from the US Drought Monitor service operated by the USDA and NOAA):
Here is the 12-month running total for rainfall at Fly Gap for the decade from 2000-2010, showing how the peaks and valleys at Fly Gap (in Mason County, in the geographical center of the state) relate to drought conditions throughout the rest of Texas (the drought maps come from the National Drought Mitigation Center):
Update, 26 October 2009: Just a full month into fall, and the predicted effects of El Niño (a rainy fall pattern, with regular Pacific moisture streaming over central Texas) are already quite evident. At the Double Helix Ranch in Mason County, we are already over our long-term average rainfall for the year. The landscape has greened up nicely with the recent rains, the stock tanks are full, and the streams are flowing. We have already had over 12" of rain in September and October 2009, and even larger totals have fallen over much of central Texas, with widespread totals between 10" and 25". Here is a map of the rainfall for the past two months, shown as a percent of the long-term average on the left, and in inches on the right:
Notice that much of central Texas has had over twice its average rainfall for the past two months, and almost all of central Texas has had above average rainfall during this period. This wet pattern is expected to continue through the fall and winter. Most of the months that show the biggest increases from El Niño conditions are still ahead of us (October through March). If we just look at the October-through-March period to date, the El Niño effects are even clearer (the maps below show the rainfall from 1-26 October 2009, as a percent of the long-term average for this period on the left, and in inches on the right):
On this map, notice that all of central Texas is well above average for rainfall in October 2009, with some areas receiving three to six times the long-term average rainfall, and widespread areas receiving two to three times the long-term average. Several areas in central Texas, and all of northeast Texas, have already received over 10" of rain for the month of October alone. An area in deep south Texas has not yet done as well, but the El Niño wet season has just begun. West Texas is also mising out on most of the rain, but that area is somewhat less likely to benefit from wet El Niño events compared to central and south Texas. The model predictions for the sea-surface temperatures in the El Niño 3.4 region continue to show an El Niño episode through the fall and winter of 2009–2010. The 2009–2010 El Niño episode should become "official" at the end of November 2009 (recall that El Niño episodes are officially declared when the ONI is above 0.5 degrees C for five or more consecutive overlapping three-month periods, which should occur at the end of November):
The black line shows the observed departures of sea-surface temperatures in the El Niño 3.4 region. The heavy blue line is the average of the various forecast models (shown by thin lines). Update, 8 March 2010: The cool, wet 2009-2010 winter for central Texas developed just as predicted above. As of early March 2010, we have experienced about 42" of rain over the past 12 months (most of which has fallen since September 2009), making this one of the four wettest periods for Fly Gap in the past 60 years. As noted above, all four of the these wettest periods have been associated with El Niño episodes, and all four have occurred within the past two decades. This is consistent with the stronger and more frequent El Niño episodes associated with the global warming that has occurred in recent decades. Here is the map of rainfall (shown as a percent of normal) from 1 January to 8 March 2010:
Rainfall, as percent of normal, for 1 Januray 2010 to 8 March 2010 The heaviest rain in fall 2009 fell in central and east Texas (see maps shown in October 2009 update), but the heaviest rains in early 2010 fell in central, north, and west Texas (see map immediately above). Central Texas benefitted from consistently above-average rainfall (and cooler temperatures) through most of the El Niño fall and winter. For the past six months, there is a large swath through central Texas that received 1.5-2 times the average rainfall (typical for an El Niño October to March period in central Texas):
Rainfall, as a percent of normal, for six months ending 8 March 2010 Although most regions of Texas have received normal or above-average rainfall during this six-month period, note that there are still dry areas, especially in Trans-Pecos Texas. Most of west Texas has just begun to receive significant rains since the beginning of the year. The current drought map for Texas shows only two small regions (one in Trans-Pecos and one in south Texas) that are considered "abnormally dry" (the least severe of the drought categories):
The forecast calls for the El Niño episode to continue through spring 2010. We are likely to return to near-neutral conditions by summer 2010:
Update, 26 May 2010: The Spring 2010 wildflower display at the Double Helix Ranch is just nice as predicted!
Update, August 2010: The return of La Niña Enjoy the wet El Niño years in central Texas, because they don't last forever! Unfortunately, the 2009-2010 El Niño is over, and we went from El Niño to neutral to La Niña conditions in summer 2010. As noted above, La Niña conditions usually mean a dry fall through spring in central Texas. Here are the lastest sea surface temperature anomalies in the equatorial Pacific, as of late July 2010:
Notice the cold (blue colors) sea surface temperatures all along the equator: the classic La Niña pattern. The follwoing graph shows how quickly we changed from El Niño to La Niña conditions in summer 2010:
Another way to visualize this is in a graph that shows temperatures along the equatorial Pacific, as they have changed through time from September 2009 to August 2010. The warm temperatures of the El Niño (red colors) are evident from September 2009 through spring 2010, but then shift to cold temperatures (blue colors) in summer 2010 (time is along the vertical axis of this graph):
As usual, models vary somewhat regarding the future strength of the developing La Niña episode, but nearly all the models are consistent in forecasting a moderate to strong La Niña from fall 2010 through spring 2011:
Unfortunately, this means a greater chance of below-average rainfall for late 2010 and early 2011 in central Texas. However, La Niña episodes tend to be more variable than El Niño episodes, and not all La Niña episodes result in drought (see above). Our best hope for wet weather comes from the usually more-active tropical storm season during La Niña years, which can bring heavy fall rains to central Texas in the remnants of hurricanes. But based on the last 60 years of La Niña episodes (15 total), we have a 73% chance of a drier-than-average October through March, a 20% chance of near-average rainfall, and about a 7% chance of wetter-than-average conditions.
Update, 8 September 2010: Tropical Storm Hermine brings heavy rains We didn't have to wait long to get the tropical system discussed above. Tropical Storm Hermine blew through central Texas (and right over Double Helix Ranch) on 7-8 September. The center of the storm moved over the ranch, but the heaviest rains in a tropical system (in the northern hemisphere) are typically on the northern and eastern sides of the storm. We received beneficial rains as Hermine approached, receiving a total of 3.03". We were lucky that we weren't east of the storm, where winds from a high over the southeastern United States fed Gulf of Mexico moisture into the storm's trailing eastern edge, and dropped 8 to 15" of rain along a long band up the I-35 corridor, from San Antonio to Austin and then north to Waco. This heavy rain caused serious flooding. Here is a map showing the rainfall totals for the past week, most of which came from Hermine:
Update, 16 November 2010: Dry La Niña season is here It is now six weeks into the October to March season when the La Niña/El Niño effects are most evident. As predicted, the 2010-2011 fall to spring season is already very dry, as is typical of a La Niña year. We have had only a trace of rain in the last two months. I just learned of an excellent web site of the South Llano Watershed Alliance (http://southllano.org/). From this site, I learned of a tree-ring study by Malcolm Cleaveland of the University of Arkansas, as reported by Paul Frommer to the Edwards Aquifer Recovery Implementation Program. For National Weather Service Division 6, which covers central Texas, tree-ring growth indicates the following for the period of 1500 to 2008: The period 1952–1956 was the fourth driest five-year period during the past 500+ years. The two driest five-year periods were in the 1700s (1713–1717, and 1739–1743), and the third-driest five-year period was in 1804–1808. So the 1950s drought was the worst one (over five years) in the past two centuries. However, when considering single years, 1956 was only the 35th driest year since 1500. Moreover, the second driest ten-year period since 1500 was 1948–1957 (only 1707–1716 was drier). No recent multiyear drought comes close to the drought of the early 1950s (as is also supported above by rainfall data), despite what has been reported in some media outlets.
Update, 7 January 2011: Dry, dry, dry first half of Fall to Spring La Niña period, 2010-2011 As discussed above, the period most affected by the El Niño/La Niña cycle is October to March. I showed a graph of the rainfall for all the El Niño and La Niña episodes for the last 60 years, and noted that in 14 of 15 La Niña years the rainfall for this period was significantly below the October-to-March mean of 12". Halfway through the period in this La Niña cycle, we are far below even the driest of these previous La Niña years so far, with just 1" of rain in October through December 2010 (and almost all of that fell in the last week of December). There is some rain forecast for this weekend, but it will take a lot to get us out of this current dry spell.
Update, 3 April 2011: Sometimes it hurts to be right; La Niña continues, but may be weakening The six-month period most affected by the El Niño/La Niña cycle (October–March) just ended, and the predicted drought certainly materialized. Here is the graph showing rainfall versus deviation in the ONI index, with the 2011 data added:
The 2010–2011 La Niña season was the second-driest in the past 60 years, with just 2.72" of rain from October 2010 through March 2011. The calendar says April, but it looks and feels like July in central Texas. The La Niña conditions are continuing, but the La Niña episode shows some signs of weakening:
Most models forecast a return to near-neutral conditions this summer:
Unfortunately, we are likely looking at continued drought conditions for a while yet. The good news is that a return to more normal conditions is on the (distant) horizon. Update, 23 May 2011: Some Areas of Central Texas Getting Rain, But Severe Drought Continues I watched some impressive storms from my front porch at the Double Helix Ranch over the last two weeks, as they dropped heavy rain to our north and east. Alas, all we received were a few drops. Here is a photo of the storms looking northeast from our ranch last week:
The severe la Niña-induced drought of 2010-2011 continues over most of Texas. Here is a map that shows the rainfall since the beginning of October 2010, shown as a percentage of normal rainfall:
At the Double Helix Ranch, we are at about 25% of normal rainfall over the past 8 months. Most of Texas is at less than 50% of normal rainfall, with the most severe drought in west Texas. Large areas of the Big Bend region have seen no measurable rain during this period. The drought, combined with high winds, high temperatures, and low humidity, is resulting in major wildfires across much of Texas, especially in the Rolling Plains and in the Trans Pecos region. Below is a photo of the Swenson Fire. which occured just south of our Dumont Division last month. The Brazos River is running black with soot:
Update, 21 June 2011: Now in the worst drought since the 1950s With no rain at all since the last update, the Double Helix Ranch is now the driest it has been in my lifetime. I was born in 1958, after the great drought of the early 1950s. I have now seen one of our ranch ponds (or "tanks," as we call them in central Texas) dry for the first time. The Llano River is about to stop flowing at Llano, as it did from late June through August of 1956. The headsprings of the Llano River are approaching the flow rates of the 1950s drought as well. This drought has not yet been nearly as long-lasting as the 1950s drought, but the past nine months have been as dry or drier than the driest periods of the long 1950s drought (which actually consisted of three severe droughts in a row, separated by two short intervals of reasonable rainfall). As I write this, I am hopefully watching a line of thunderstorms to our north, hoping that they will make it down this way. [That storm brought 1-2" of rain to many areas of central Texas, but only dropped 0.3" at my ranch.] But we need some sustained heavy rain to make a dent in this drought; our best bet for that is a tropical storm from the Gulf of Mexico. Update, 8 August 2011: We are in record territory, with a poor long-term outlook It has been a miserable summer, with record heat and virtually no rain in central Texas. In the past 11 months, we have recorded 5.13" of rain at the Double Helix Ranch. We have already recorded less rain in the past year than in any other 12-month period on record, and almost half of that total fell in the first week of September 2010. So, unless we get a big tropical system that drops a lot of rain, in another month our 12-month running total will be at about half the previous record low for any comparable period since rainfall records have been kept. The early 1950s drought lasted much longer than our current drought has existed so far, but the past year was worse than any single year during that five-year drought-of-record. The question on everyone's mind is: "How much longer will our current drought persist?" Earlier this summer, the long-term models pointed to an end to our La Niña episode, and we have indeed returned to nearly neutral El Niño/La Niña conditions, even though the weather has yet to shift out of the La Niña pattern of hot and dry. The bad news, though, is that some long-term models point to a return to La Niña conditions. Just as some economists are talking about a double-dip recession, there is now a 50% chance of a double-dip La Niña, with about an equal chance for continuing neutral conditions. There is no sign of an El Niño episode that might bring substantial relief in the near future. The relatively good news: we are indeed currently in neutral El Niño/La Niña conditions:
The bad news is that the weather pattern does not have any drivers to change the current conditions, so we are stuck in drought. The Double Helix Ranch shares the unfortunate distinction with much of west and south Texas of receiving only 0–25% of its normal rainfall over the past year:
The worse news is that the long-term predictions don't look promising, with the conditions staying neutral at best and returning to another La Niña episode at worst:
Meanwhile, all our surface water at the ranch is gone, and we are hoping against hope that our last ranch well does not go dry. To conserve what water remains for our cattle, we have abandoned trying to keep our fruit and nut trees alive. Oak trees all over the ranch are dropping their leaves, and we are likely to see many trees lost to this drought even if rains return soon. Our best hope remains a tropical storm, but the tropical season has been a disappointment so far. Tropical Storm Don looked very hopeful last month, but strangely dropped little rain anywhere in Texas, and none at the Double Helix Ranch. Update, 28 August 2011: A record hot summer, combined with a record drought We have already had highs of over 100 for 73 days this summer, with highs of 110 the past few days. The live oaks across the ranch are mostly leafless, and the post oaks, blackjack oaks, and Texas red oaks are brown and look like winter:
Below are some comparisons of the ranch in late spring/early summer, after El Niño years compared to after La Niña years:
2007, after El Niño winter (top), versus same scene in 2011, after La Niña winter (bottom)
2010, after El Niño winter (top), versus same scene in 2011, after La Niña winter (bottom) Update, 6 December 2011: We Are In Record Territory, But Finally Seeing Signs of a Weakening La Niña People keep e-mailing me, hoping that I'll update this article with some good news. The best new news that I can think of since the last update in August is this: We are three months closer to the eventual end of this drought, and we are beginning to see some signs that the La Niña is finally weakening. By late September, we had completely busted all records for the lowest 12-month rainfall ever recorded, or even estimated from 500-year-old tree-ring studies, in Central Texas. At the Fly Gap Division of the Double Helix Ranch, we recorded 5.29" of rain from 26 September 2010 to 25 September 2011. That is about half of the lowest rainfall total ever recorded in the worst year of the early 1950s drought. We are finally starting to see some changes in the La Niña weather pattern, however. We did get one good rainfall at Fly Gap in early October (our first rainfall of >2" in over a year), and that was followed by a few light rains (each less than a quarter of an inch) in November. That is well below our average rainfall for October and November, but considerably better than 2010, when only 0.05" fell in all of October and November. Then, on the first weekend in December, there were widespread soaking rains from a Pacific storm that slowly moved over Texas. The recent rains were enough to stimulate a lot of germination from seeds that were still waiting for last spring's rains! I've even noticed a few trees (overwise leafless from the summer drought) sprouting some new leaves, fooled into thinking it must be spring. Through the end November, we were still at just 8.82" of rain for the previous 12 months, which would have been a record low total anytime before September of this year. After this past weekend, we are now up to 11.05" for the past year...a remarkably low 12-month total, but half of that has fallen in the past two months! The double-dip La Niña conditions continue, and are expected to continue into spring. About half of the models show a continuing weakening, and about half show some strengthening of the La Niña conditions. Although we have already received more rain than we did last winter (which was extreme, even for a La Niña), the drought is unlikely to end before the middle of 2012, at best. That means we can continue to expect a warmer, drier winter than average across much of Texas, but with more rainfall than last year. We are so far behind in rainfall now that it will take a long period of wet weather to pull us out of this. The photos below show the Fly Gap Division of Double Helix Ranch as seen on Google Earth, and compare the view in October 2008 (when we were in a moderate drought) to October 2011 (our current, most severe one-year drought on record). Note that most of the oak trees (except along creekbeds) had lost their leaves by October 2011, and a large number of centuries-old oaks had died. The contrast between the green canopy cover in October 2008 and the brown, leafless trees in October 2011 is remarkable.
----------------------------------------------------- For comments or queries, please contact: David Hillis, Double Helix Ranch, doublehelix@att.net
|
|